Readings, trips, diagnostics and saved entries: nine screenshots and illustrations with the context needed to interpret them.
The first four views use an OBD simulator. Populated histories contain synthetic test data, not real journeys or performance results. The diagnostic screen shows a read without DTCs, not proof that every possible fault is absent.
Edited demo illustration
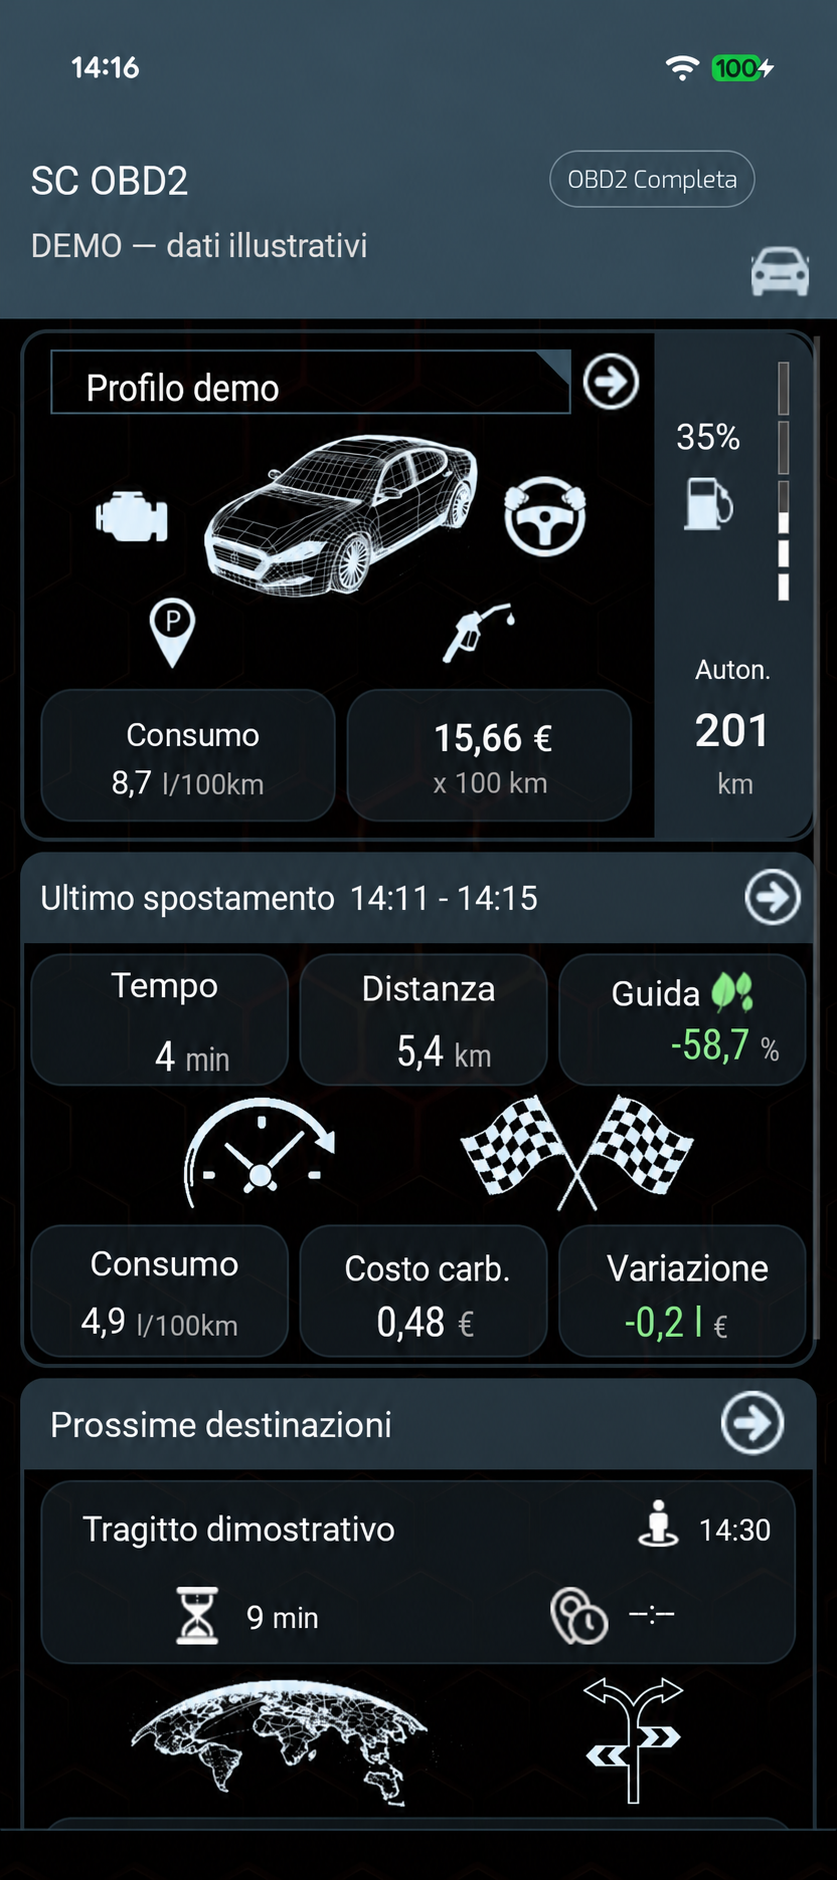
Home and last trip
Find the vehicle profile and the last session summary in one place.
Demo home: 4 minutes, 5.4 km and an illustrative cost of €0.48. Edited image with example data, not a real trip result.
How to read this screen
Edited demo illustration. The profile’s consumption (8.7 l/100 km) is distinct from the trip’s (4.9 l/100 km). Costs and range are calculated examples; the Driving and Variation indices do not demonstrate savings. The route is fictional and does not identify real places.
Edited demo illustration
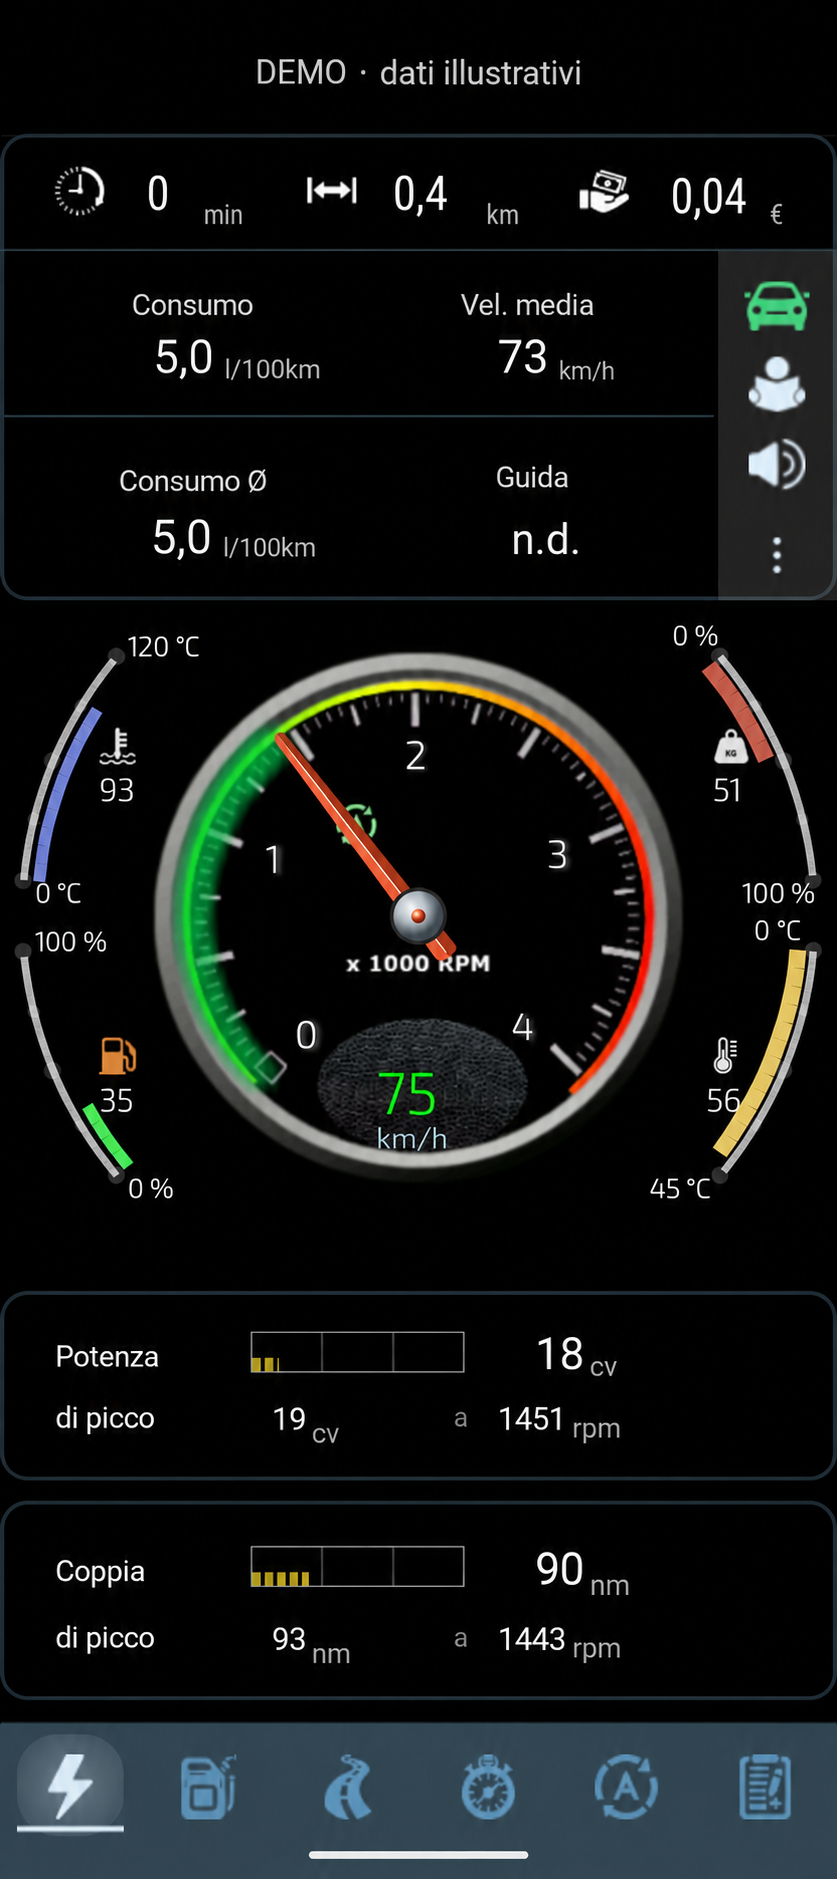
Dashboard with OBD readings
Read several available parameters at a glance, together with their units.
Demo dashboard with illustrative OBD readings and example cost. Edited image: not a road test or a certified measurement.
How to read this screen
This edited illustration does not document driving at 75 km/h or establish the accuracy of power or torque values. Some fields are estimates rather than direct measurements. A static image does not demonstrate smooth animation.
Bench demonstration data
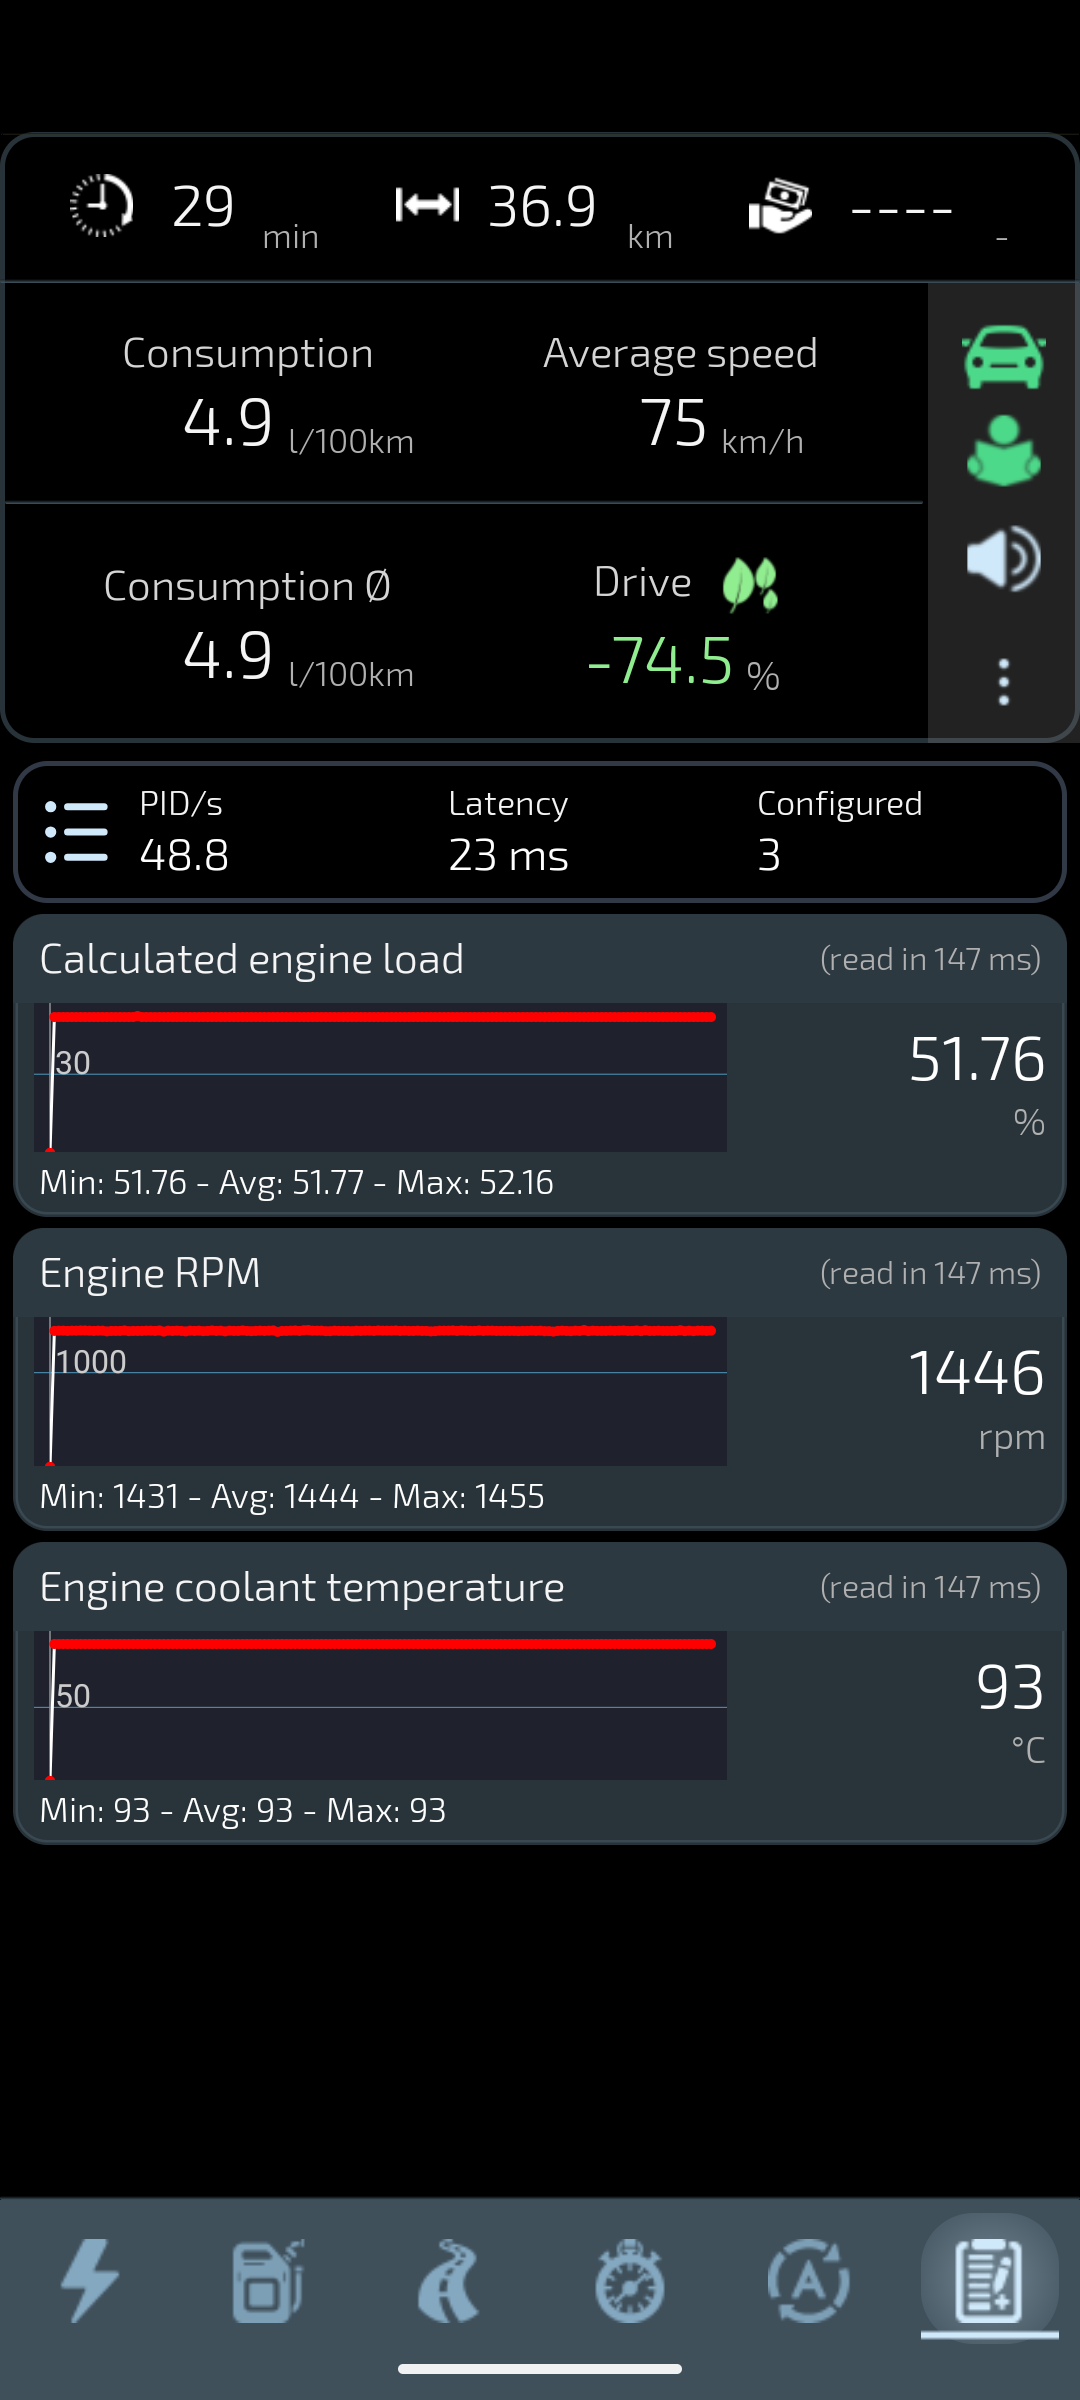
Live Data: three parameters
Compare engine load, RPM and coolant temperature, reading each parameter’s value, unit and trend.
Live Data showing engine load, engine speed and coolant temperature with demonstration OBD data. English interface.
How to read this screen
Despite the historical tab name, this graph is not a DTC view. Displayed frequency and latency describe a test sample, not a general guarantee.
Edited demo illustration
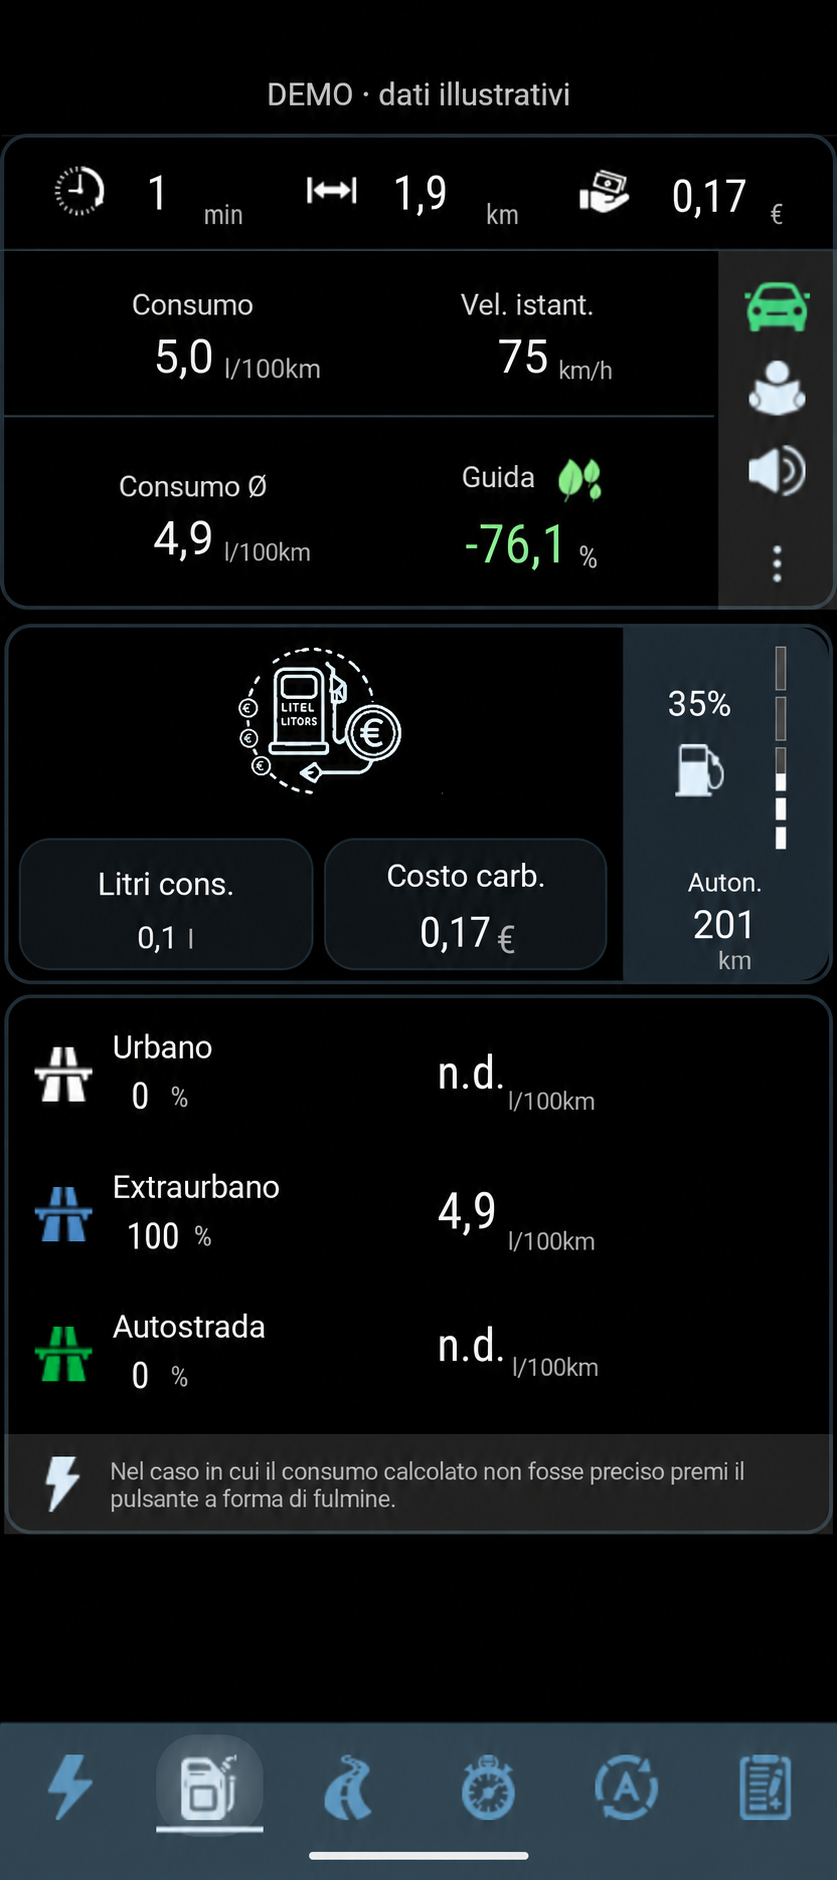
Session fuel information
Distinguish fuel quantity, tank level and consumption per unit distance.
Illustrative fuel example: 0.1 l rounded, €0.17 cost and 201 km estimated range. Edited image using stated assumptions.
How to read this screen
The added fields are illustrative examples using fuel at €1.80/l and a 50 l tank. Cost uses unrounded fuel consumption; range uses the vehicle profile’s consumption. These are not real test results or guarantees of savings or accuracy.
Synthetic test data
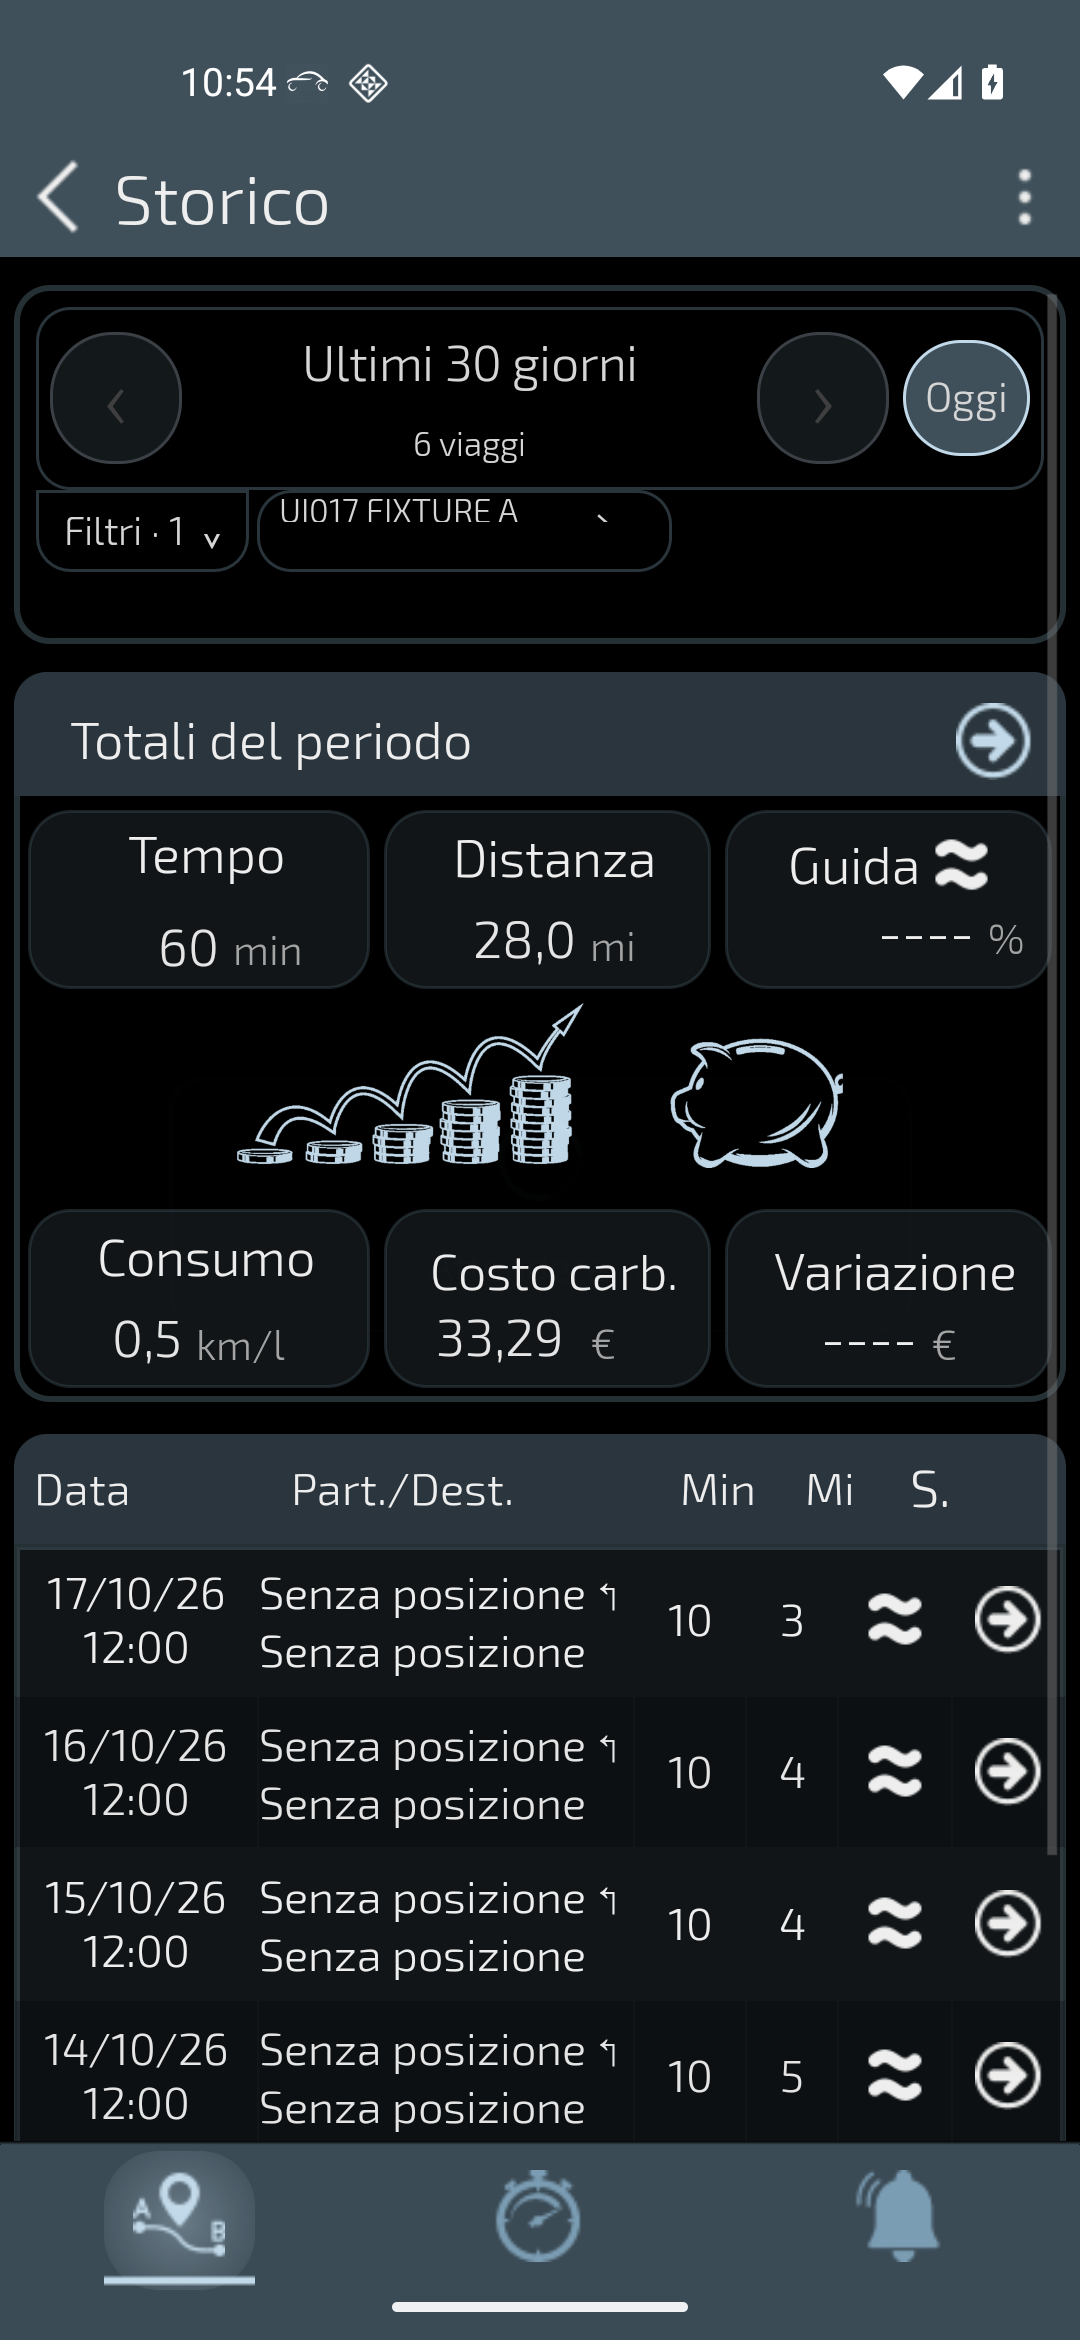
Multiple-trip history
Find several saved entries and compare the totals for a selected period.
App history populated with synthetic test entries: 6 demonstration trips, without real locations.
How to read this screen
Pre-existing synthetic test entries, not real journeys or an integrated demo mode. Distances are in miles, not kilometres. Do not infer real-world efficiency from these synthetic entries.
Synthetic test data
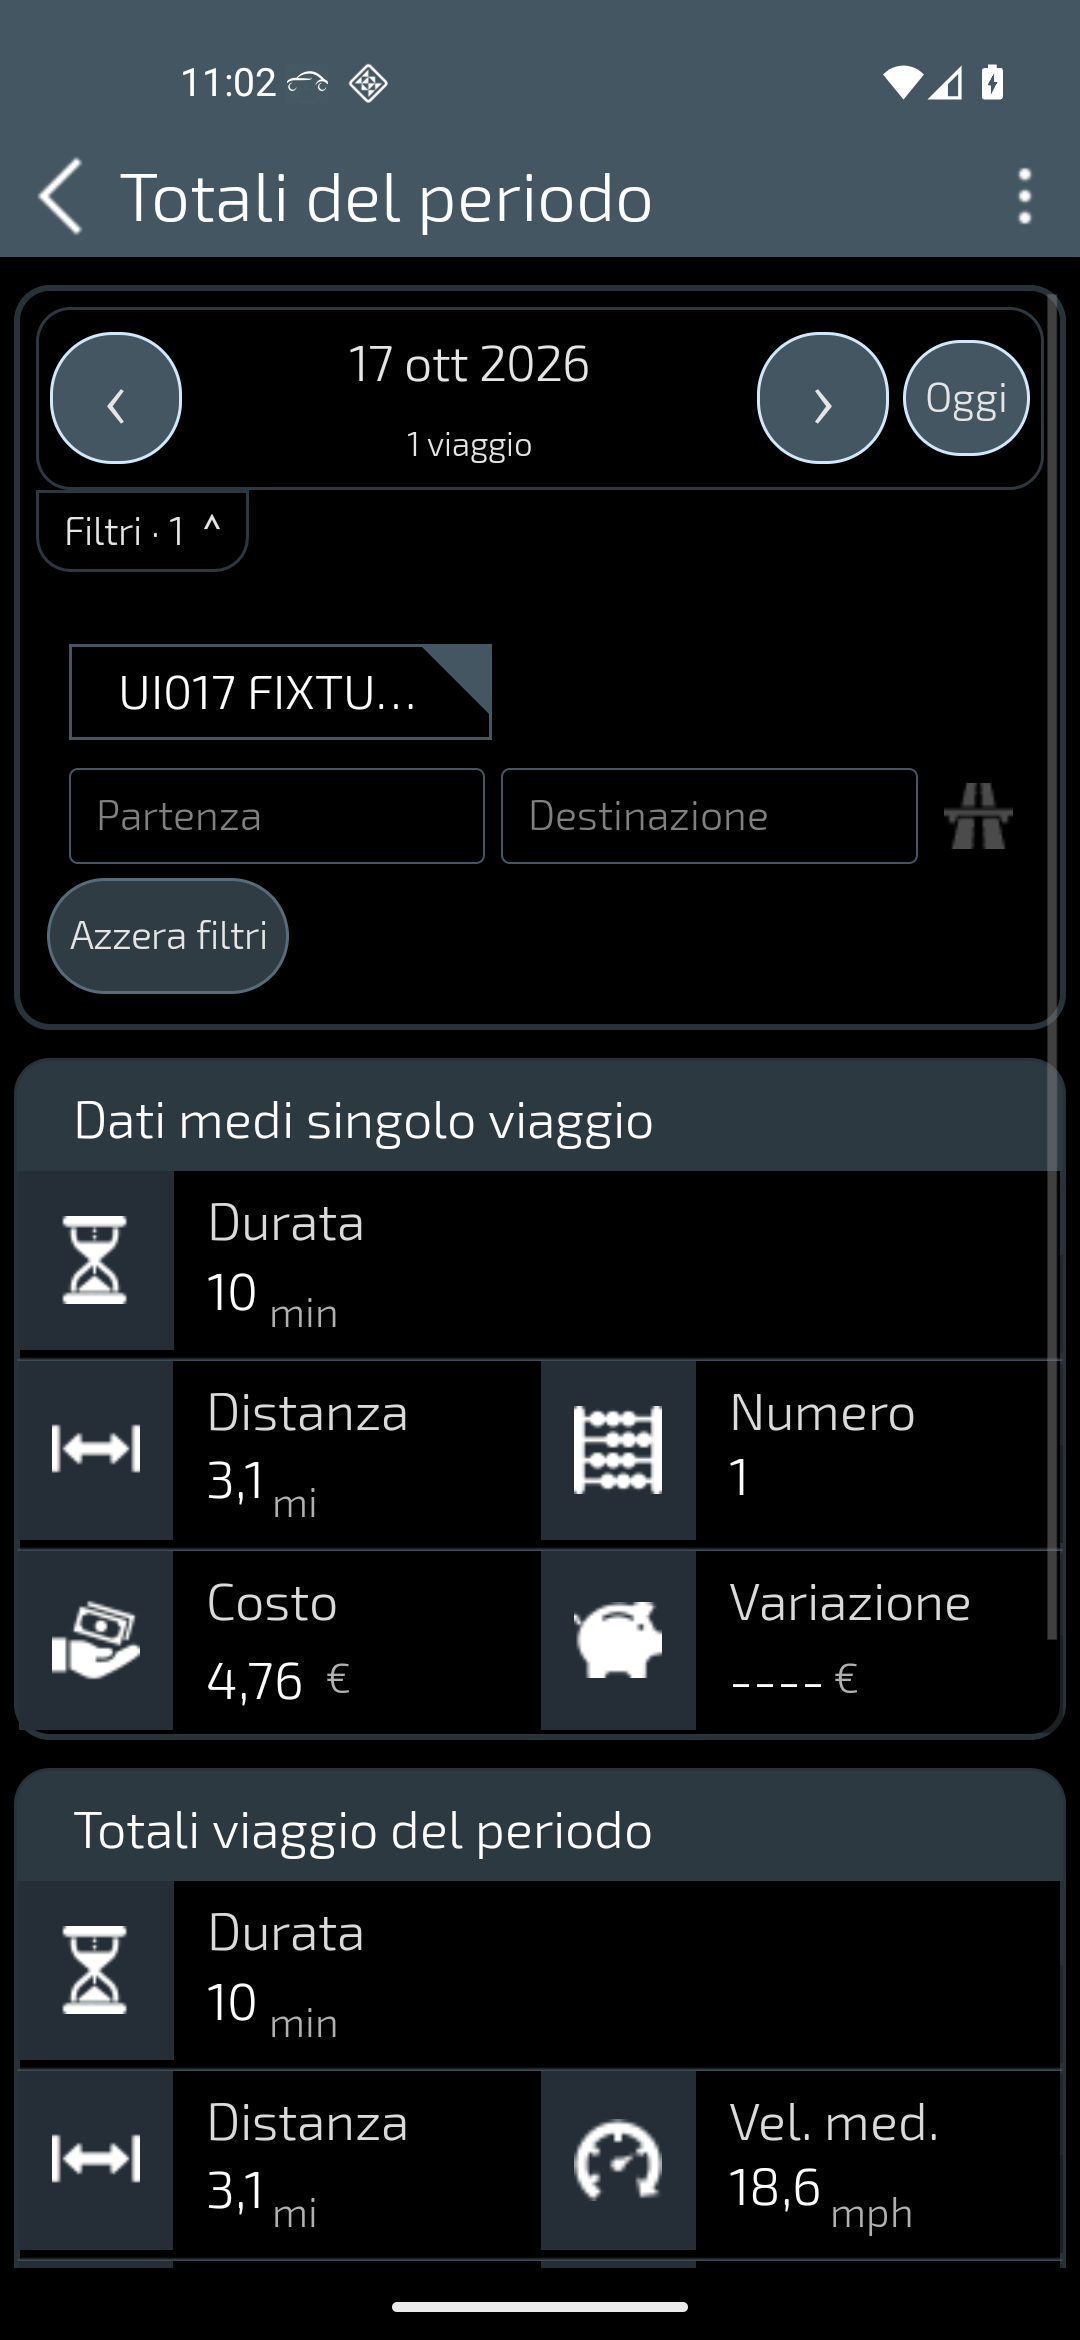
Selected-period totals
Read duration, distance, trip count and average speed together.
Totals for a period containing one demonstration trip: 10 minutes and 3.1 miles. Synthetic data.
How to read this screen
This is a totals view, not the original trip-detail page. Values are synthetic and use imperial units; cost and consumption are not real-world results.
Illustration
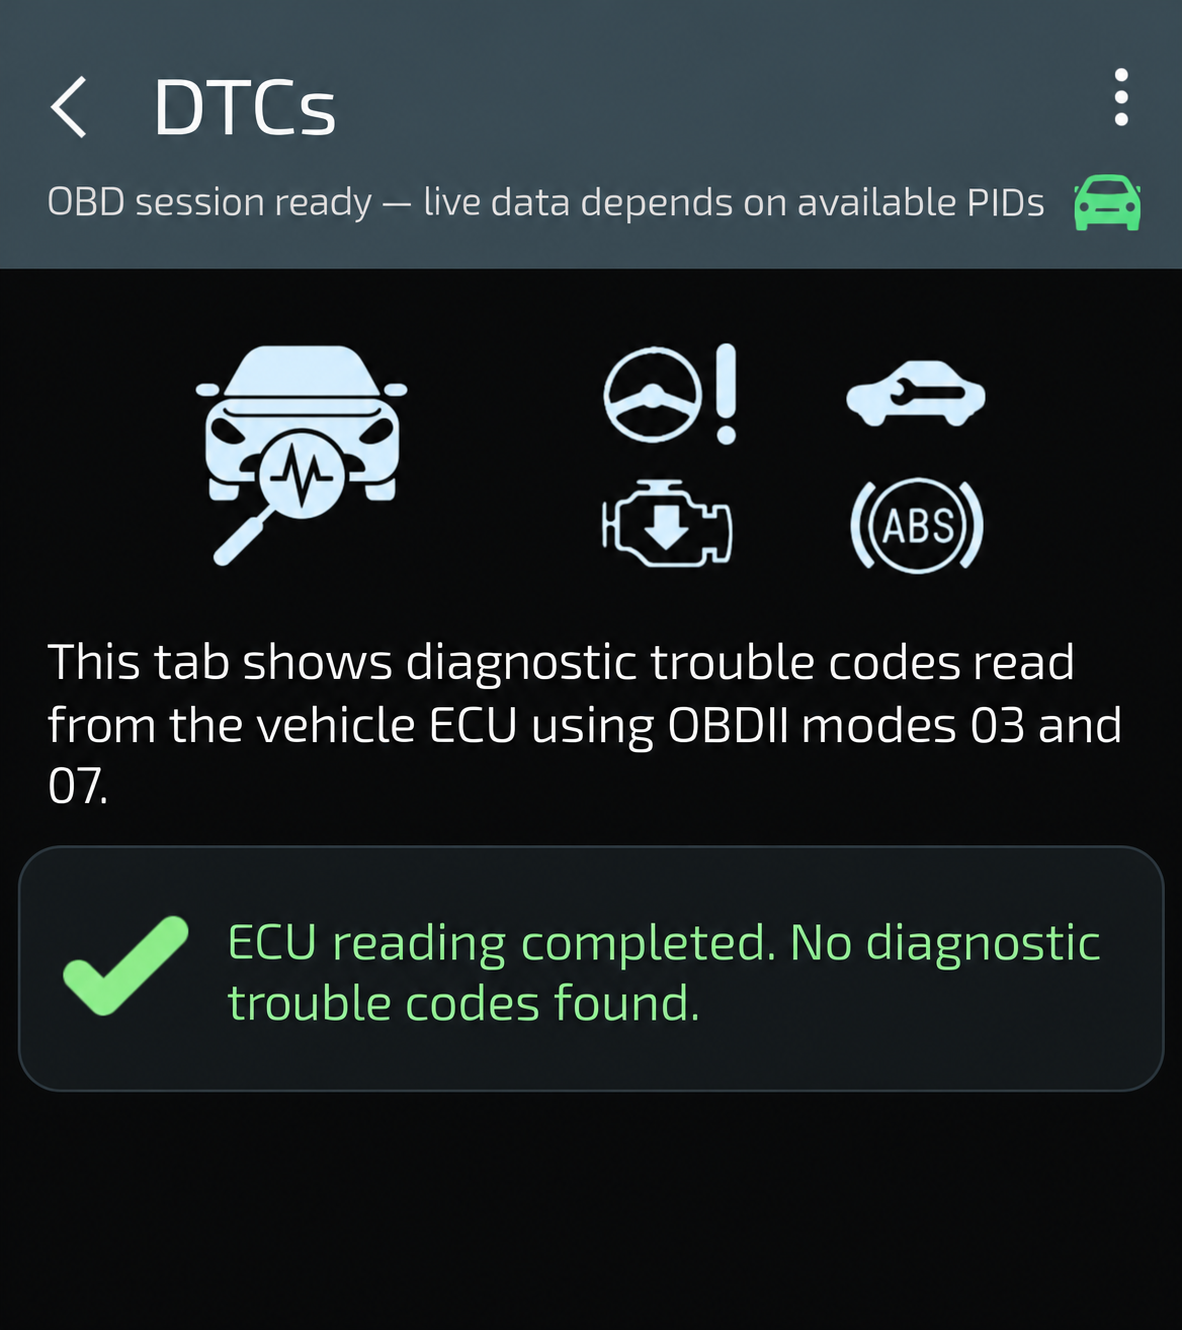
Diagnostic read result
Understand that a diagnostic read can also return no trouble codes.
Illustration of a reading with no DTCs found, using the current interface style. It is not a new vehicle test.
How to read this screen
No DTCs found does not prove the vehicle has no faults. This is not code clearing, and the source vehicle or simulator is not established for this capture.
Synthetic test data
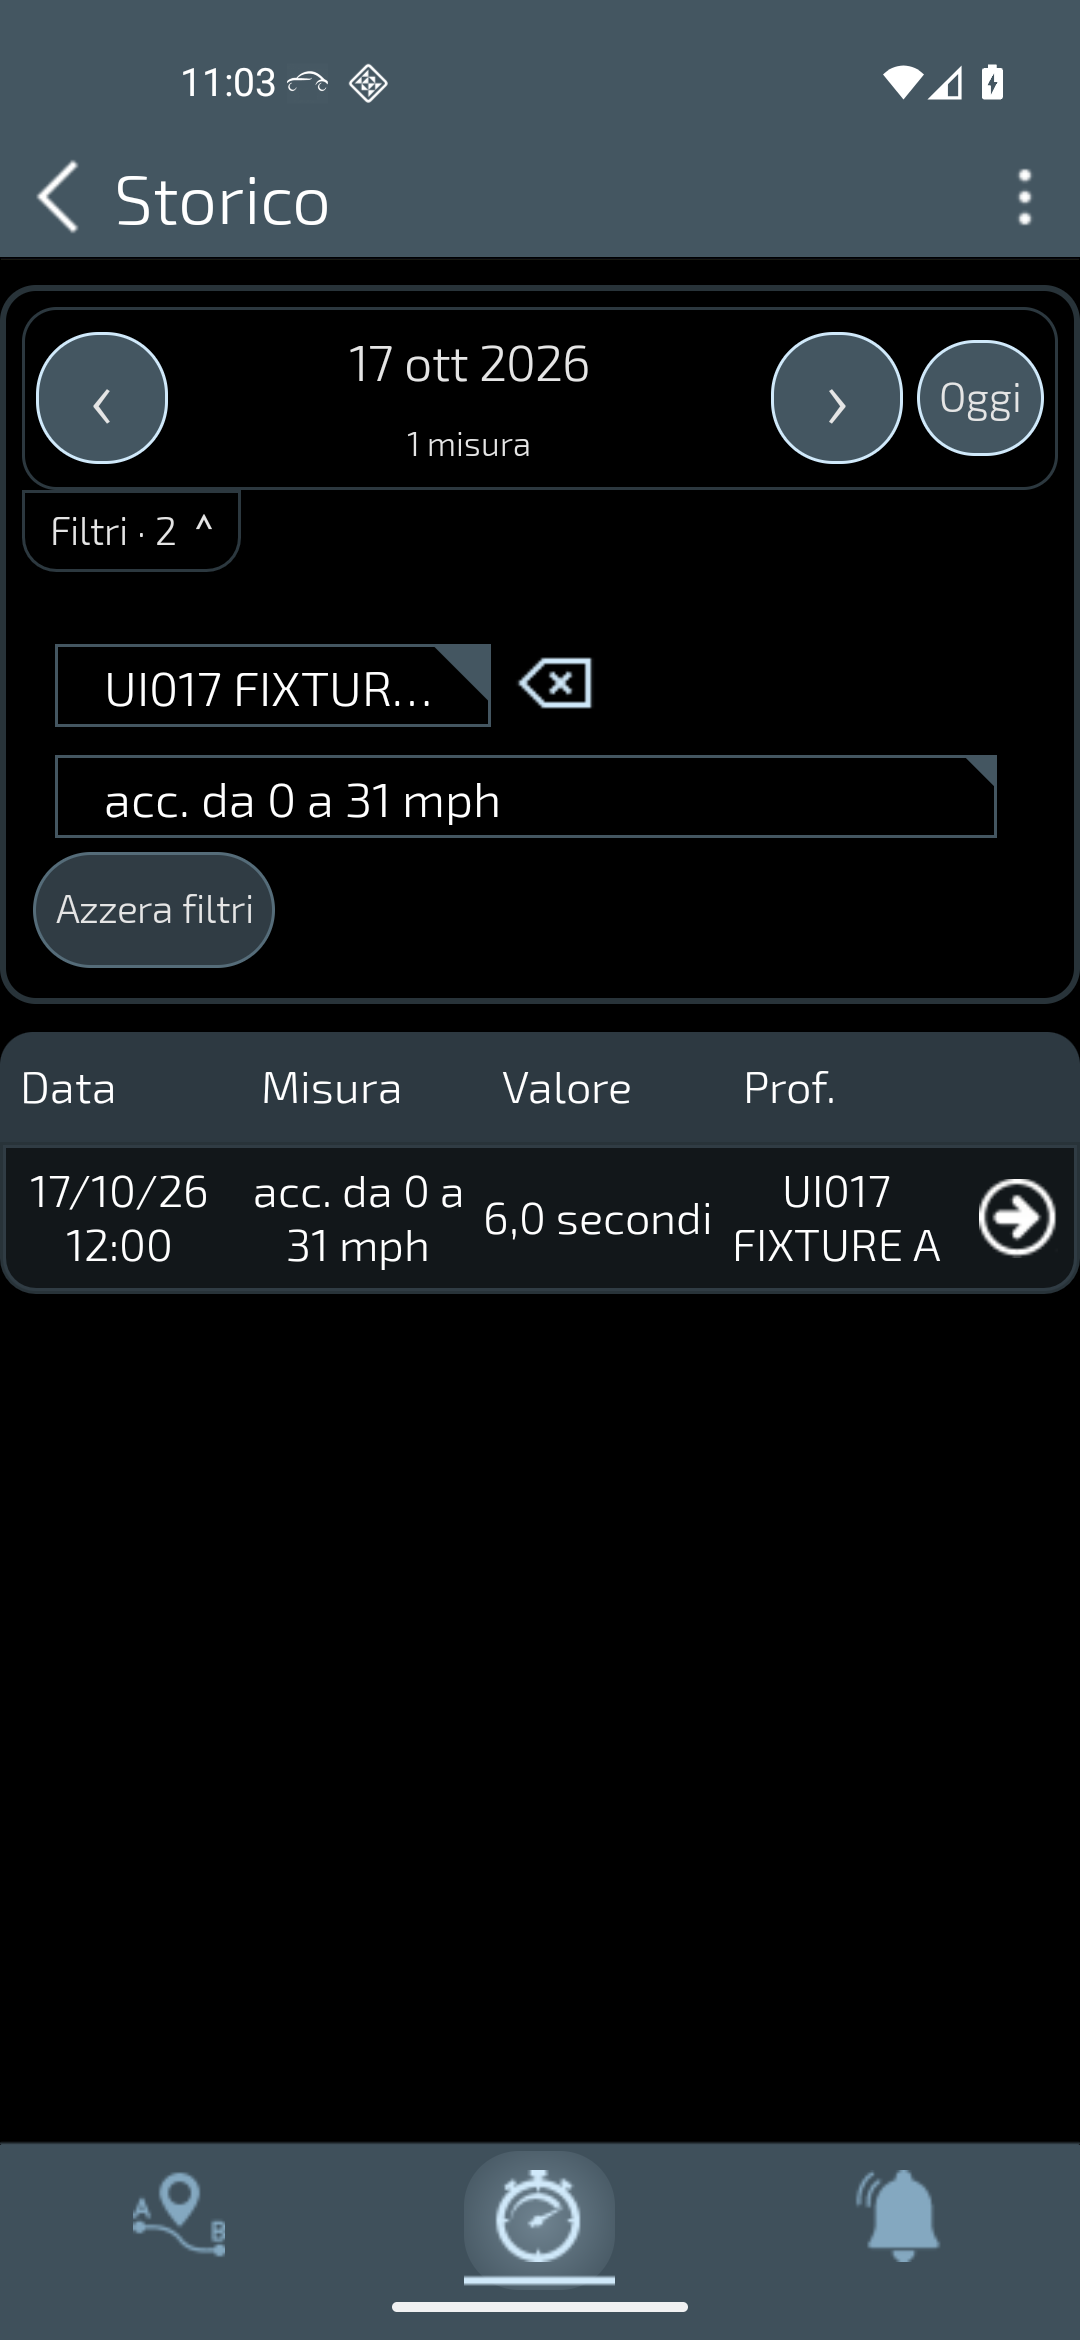
A measurement in history
Find a saved measurement and identify the type of test it represents.
Measurement history containing a synthetic test entry: 0–31 mph in 6.0 seconds. Synthetic data, not a road performance result.
How to read this screen
Synthetic history entry, not a road performance result, accuracy benchmark, running stopwatch or RAM-only session.
Synthetic test data
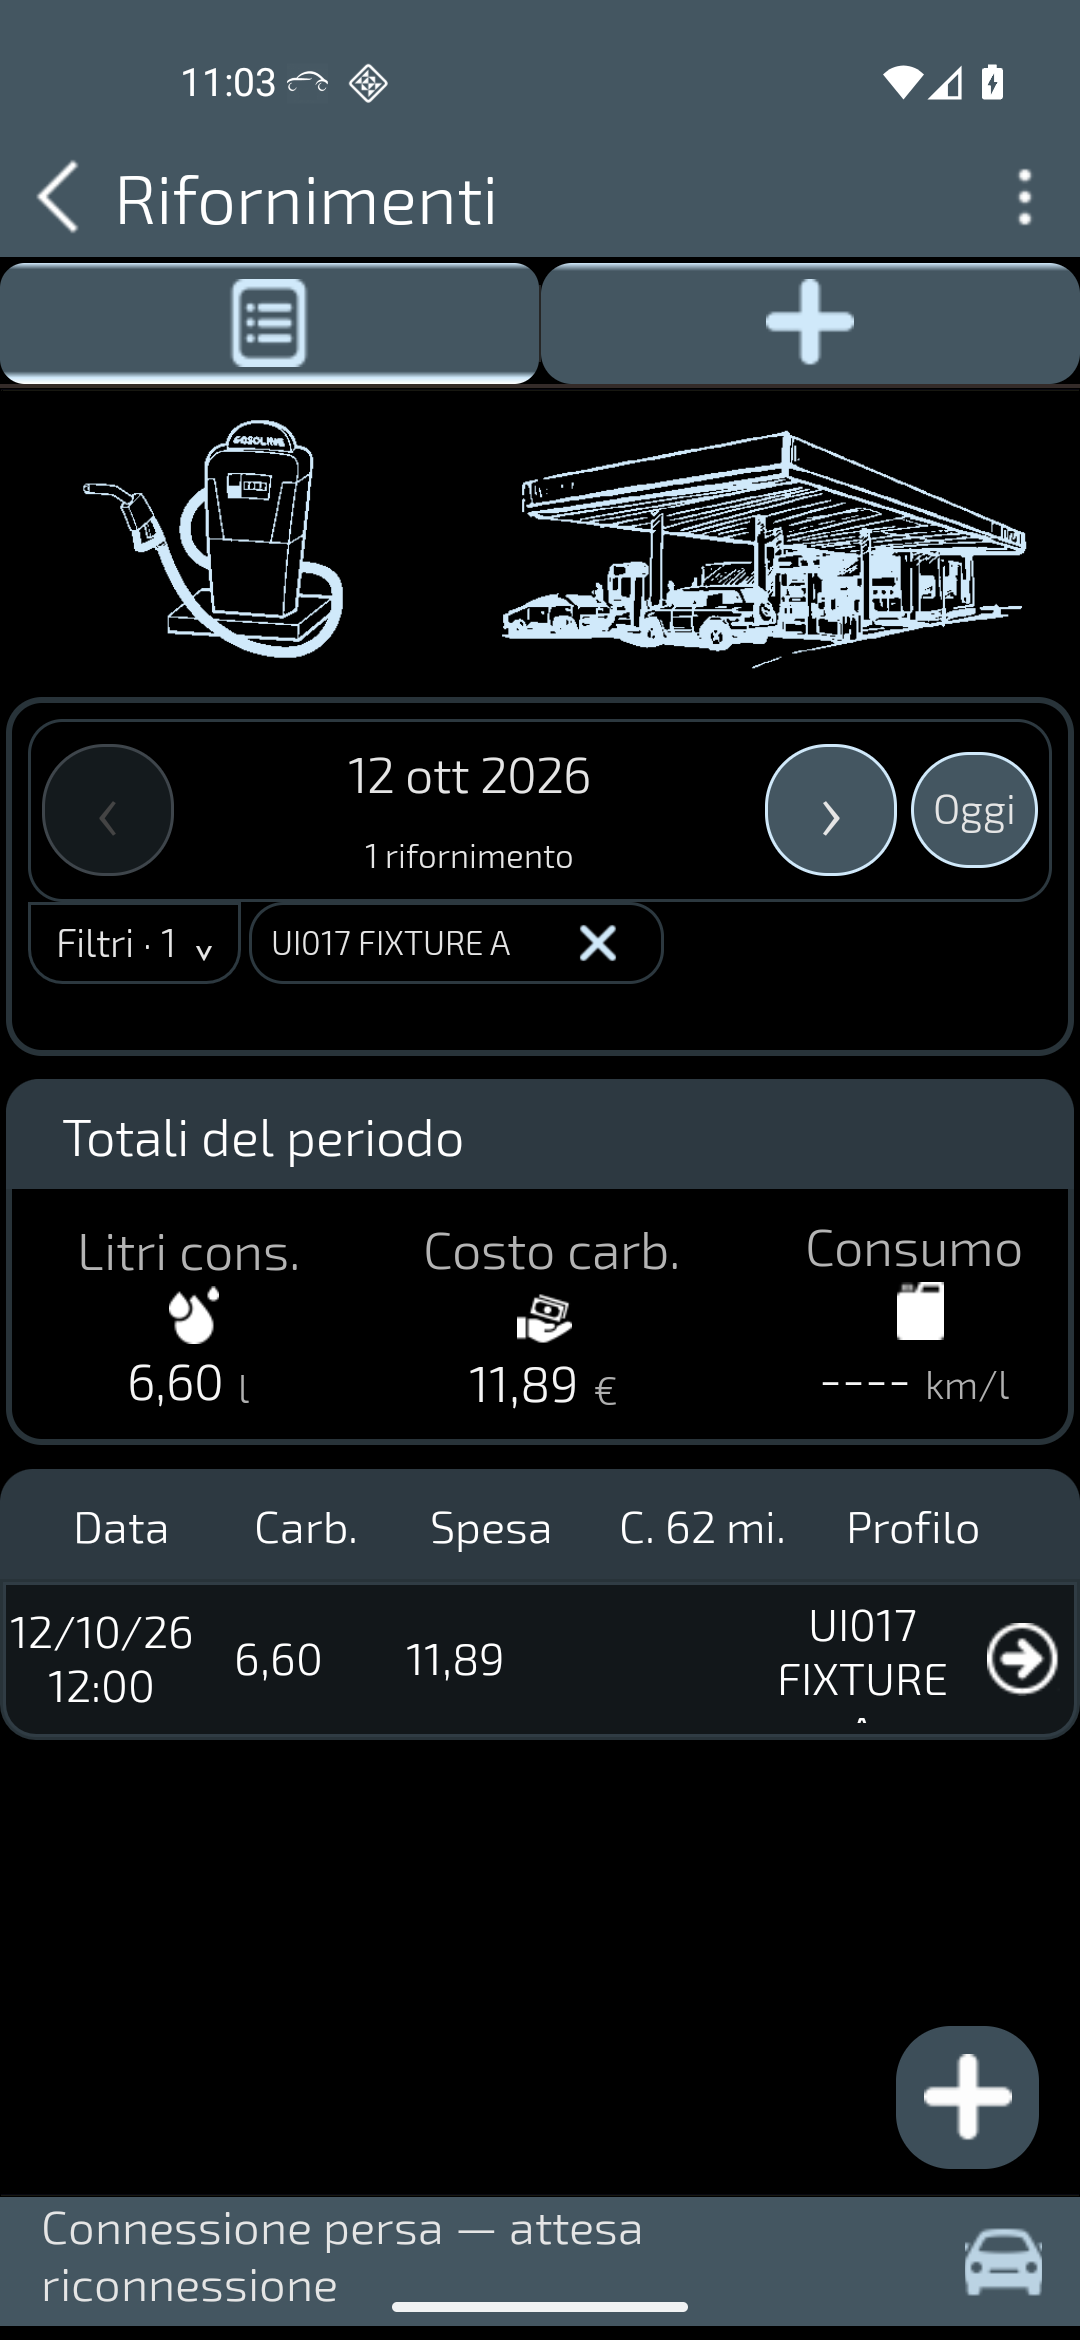
Refuelling and spending
Relate refuelling entries to a selected period and recorded spending.
Refuelling view with one demonstration entry: 6.60 litres and 11.89 euros. Synthetic test entries.
How to read this screen
This is a synthetic entry, not a current fuel price or physically measured consumption. The category “Litri cons.” retains the app’s wording; it is not evidence of a physical measurement.