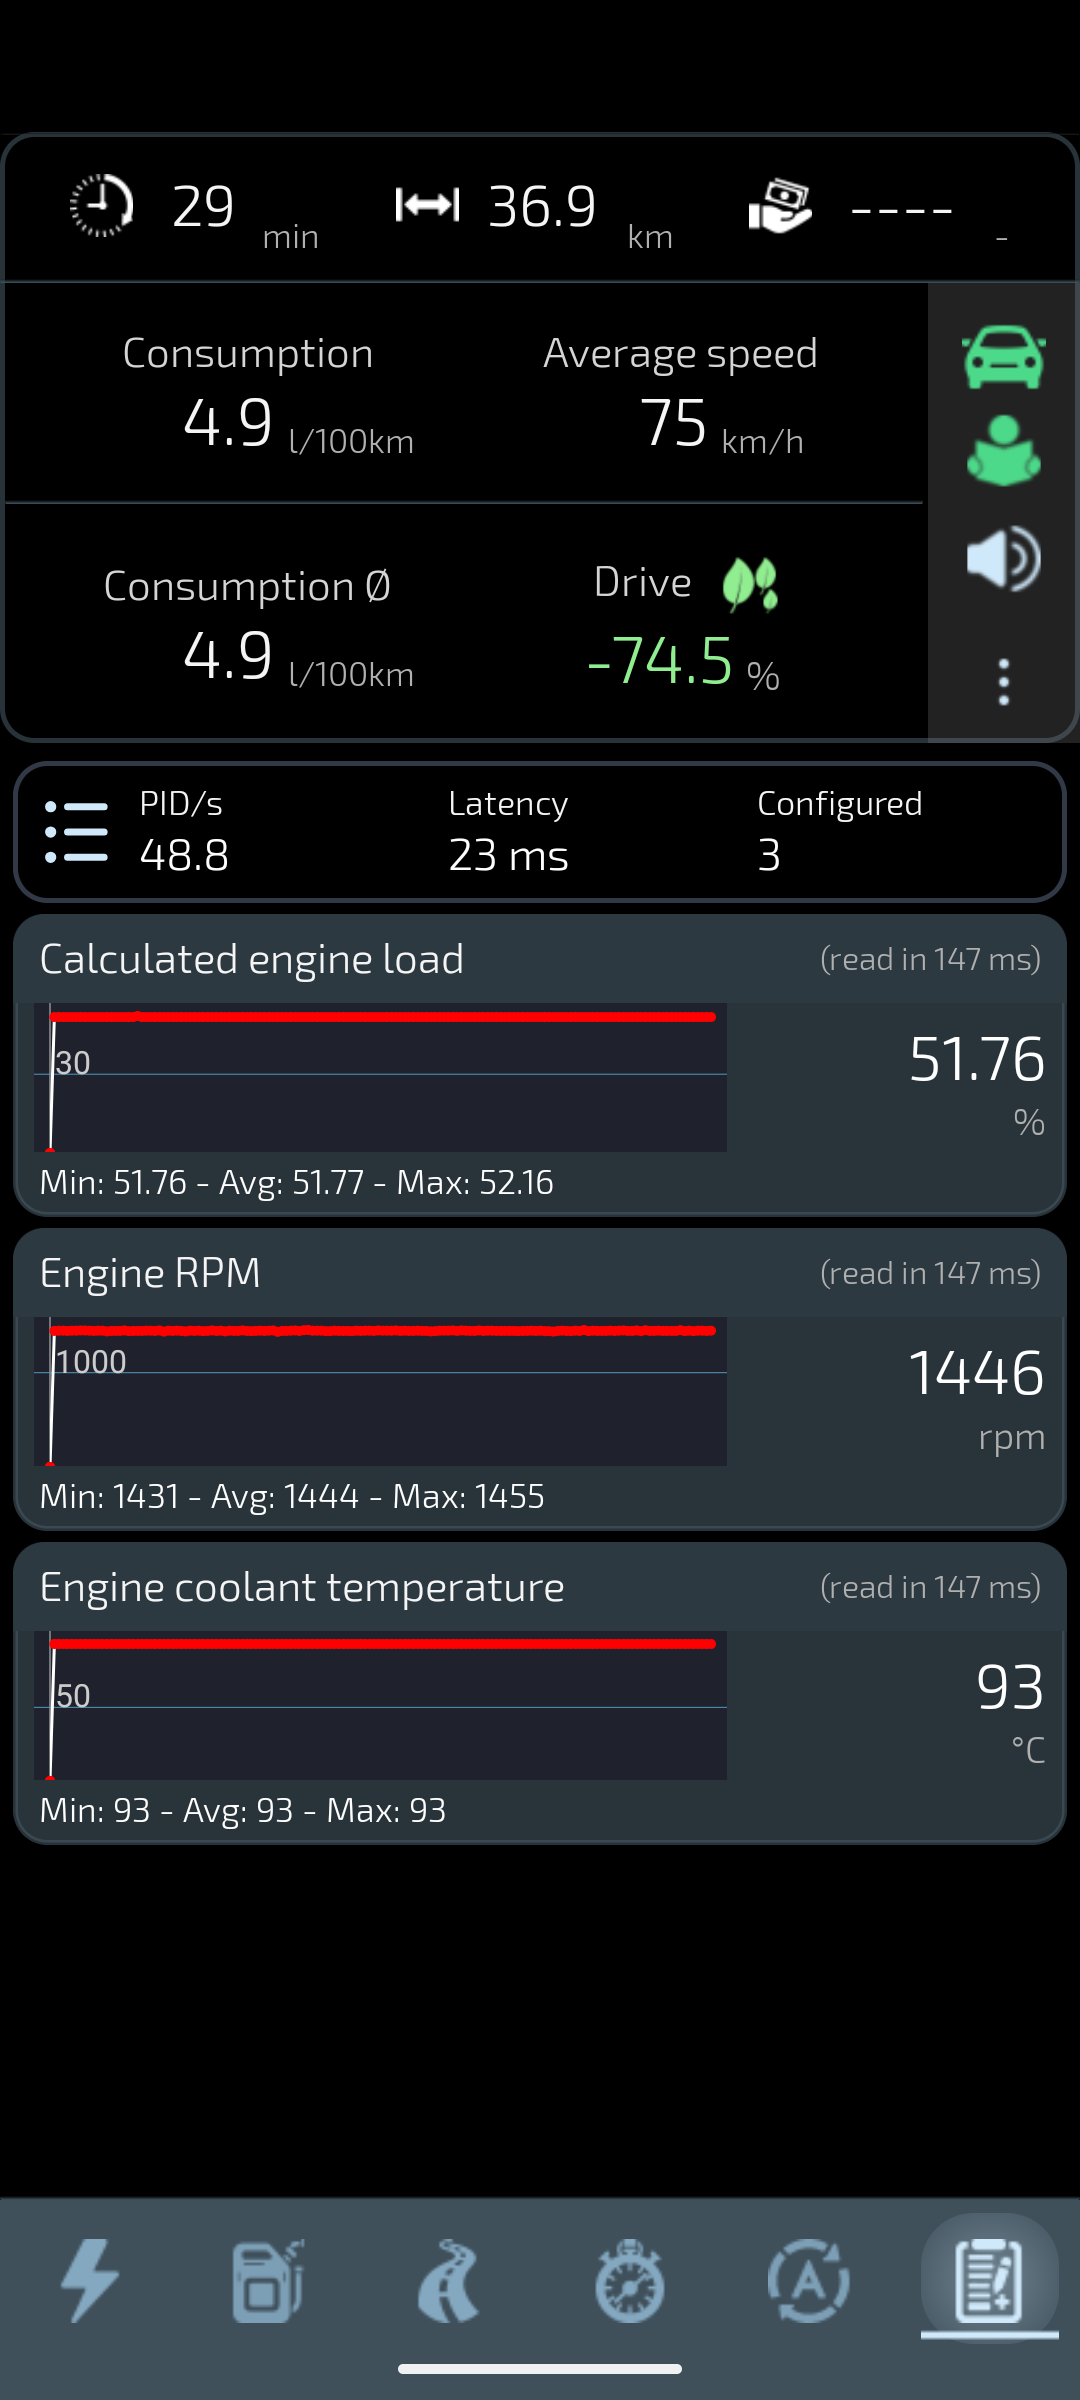
Bench demonstration dataLive Data: three parameters
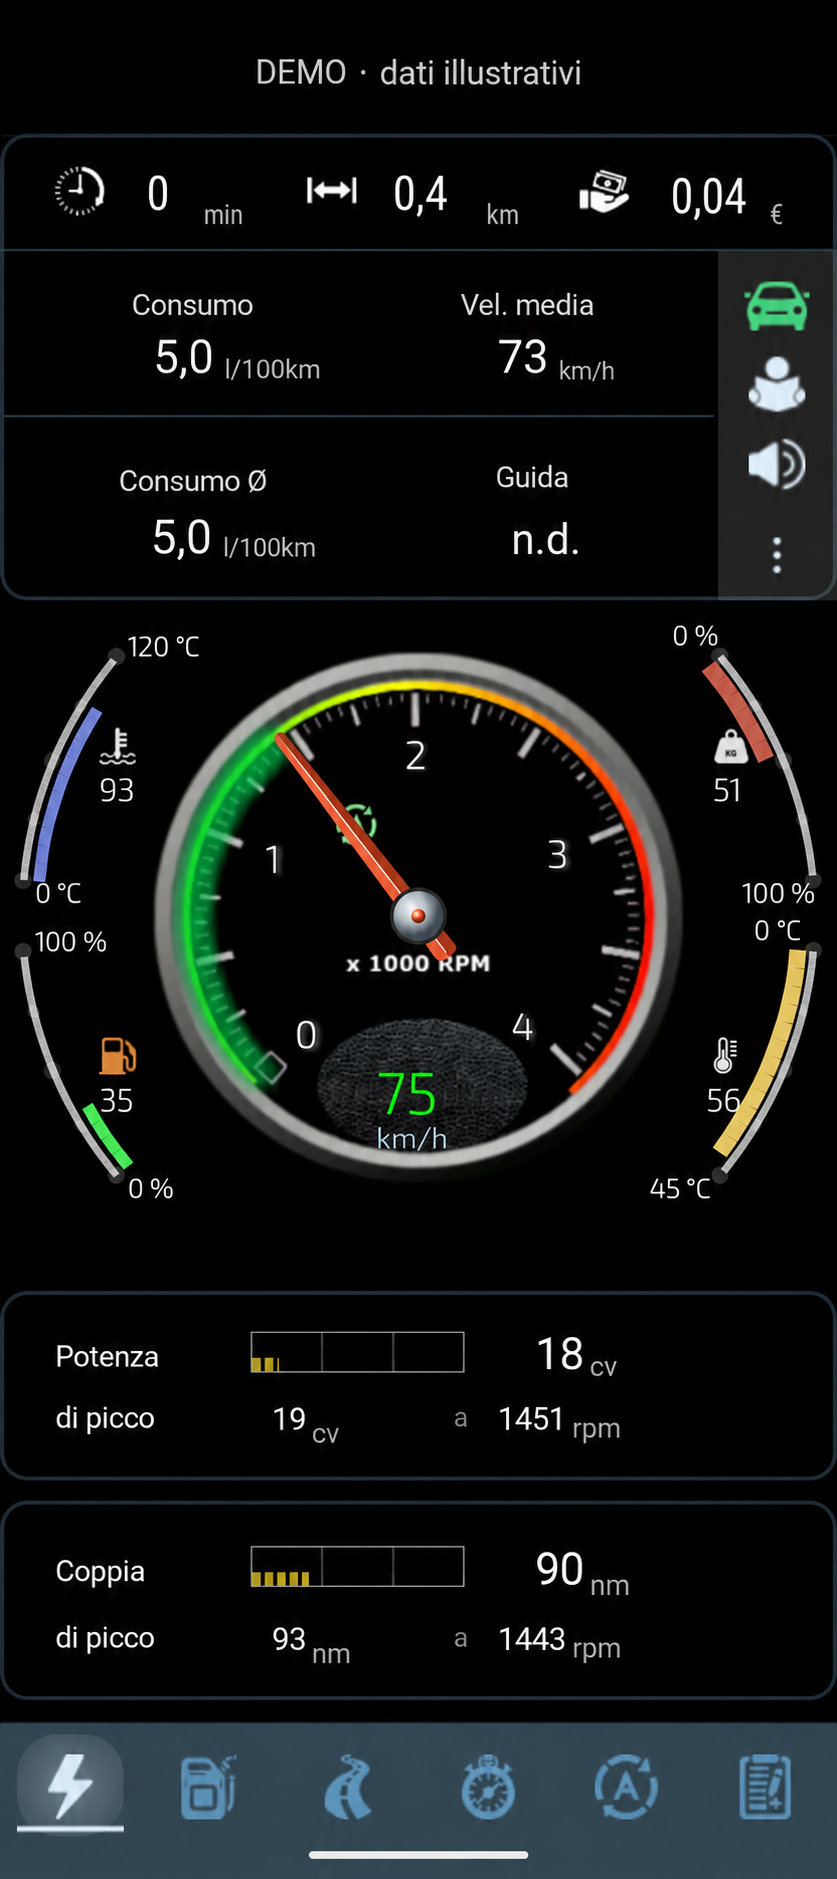
Compare engine load, RPM and coolant temperature, reading each parameter’s value, unit and trend.
Live Data showing engine load, engine speed and coolant temperature with demonstration OBD data. English interface.
How to read this screen
Despite the historical tab name, this graph is not a DTC view. Displayed frequency and latency describe a test sample, not a general guarantee.
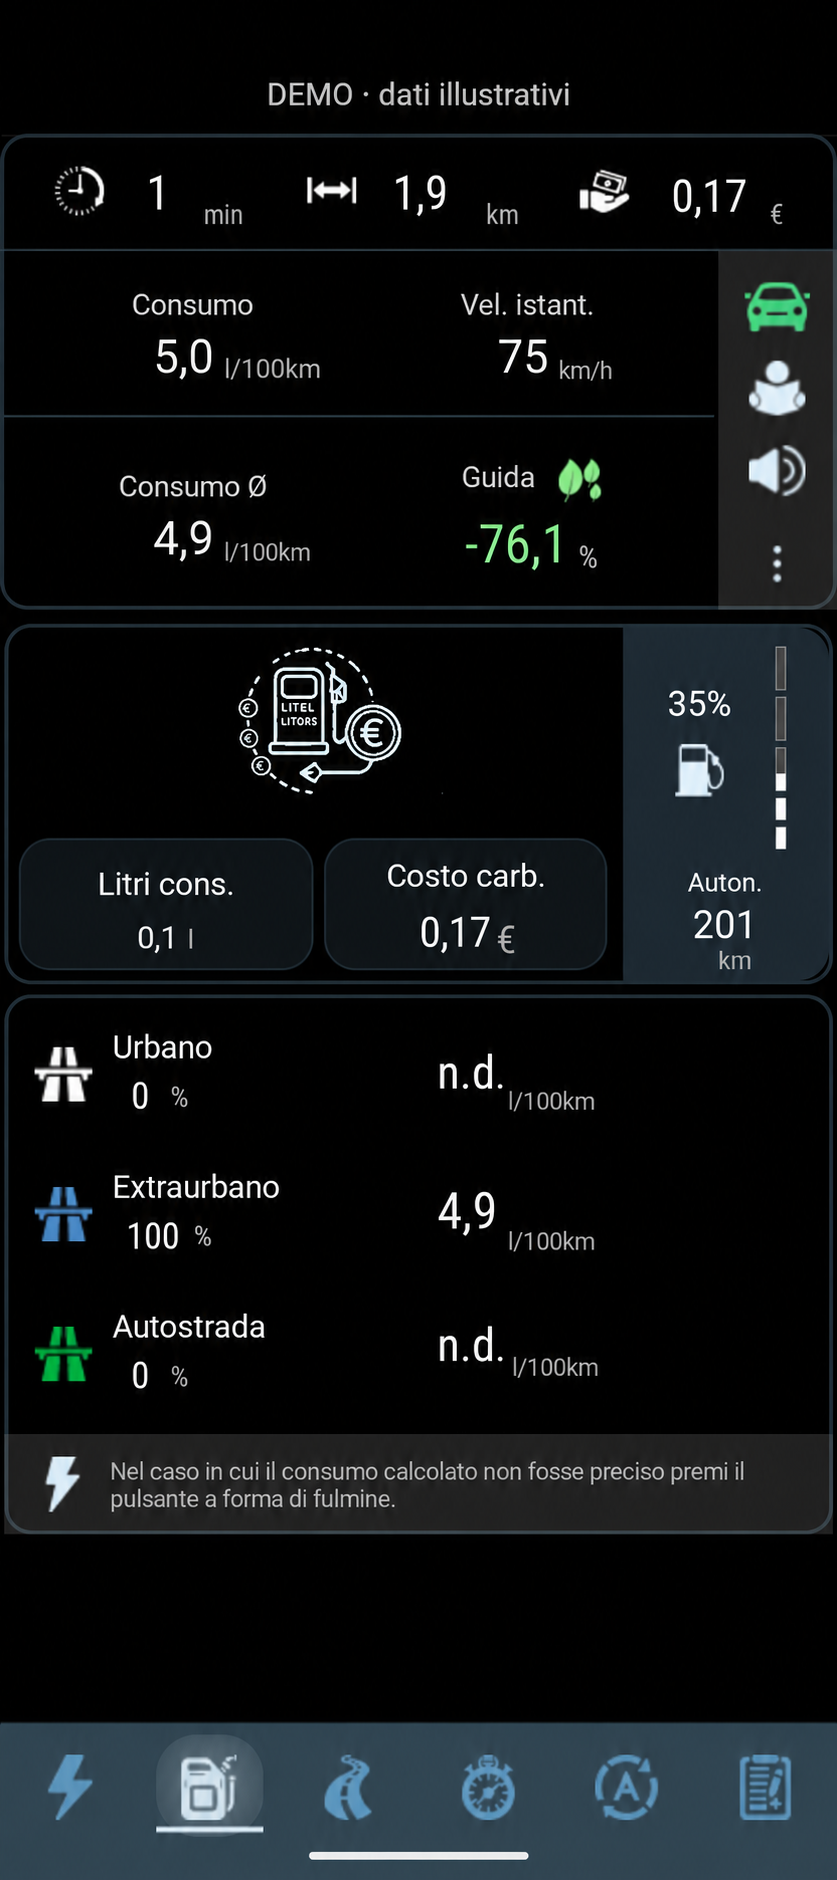
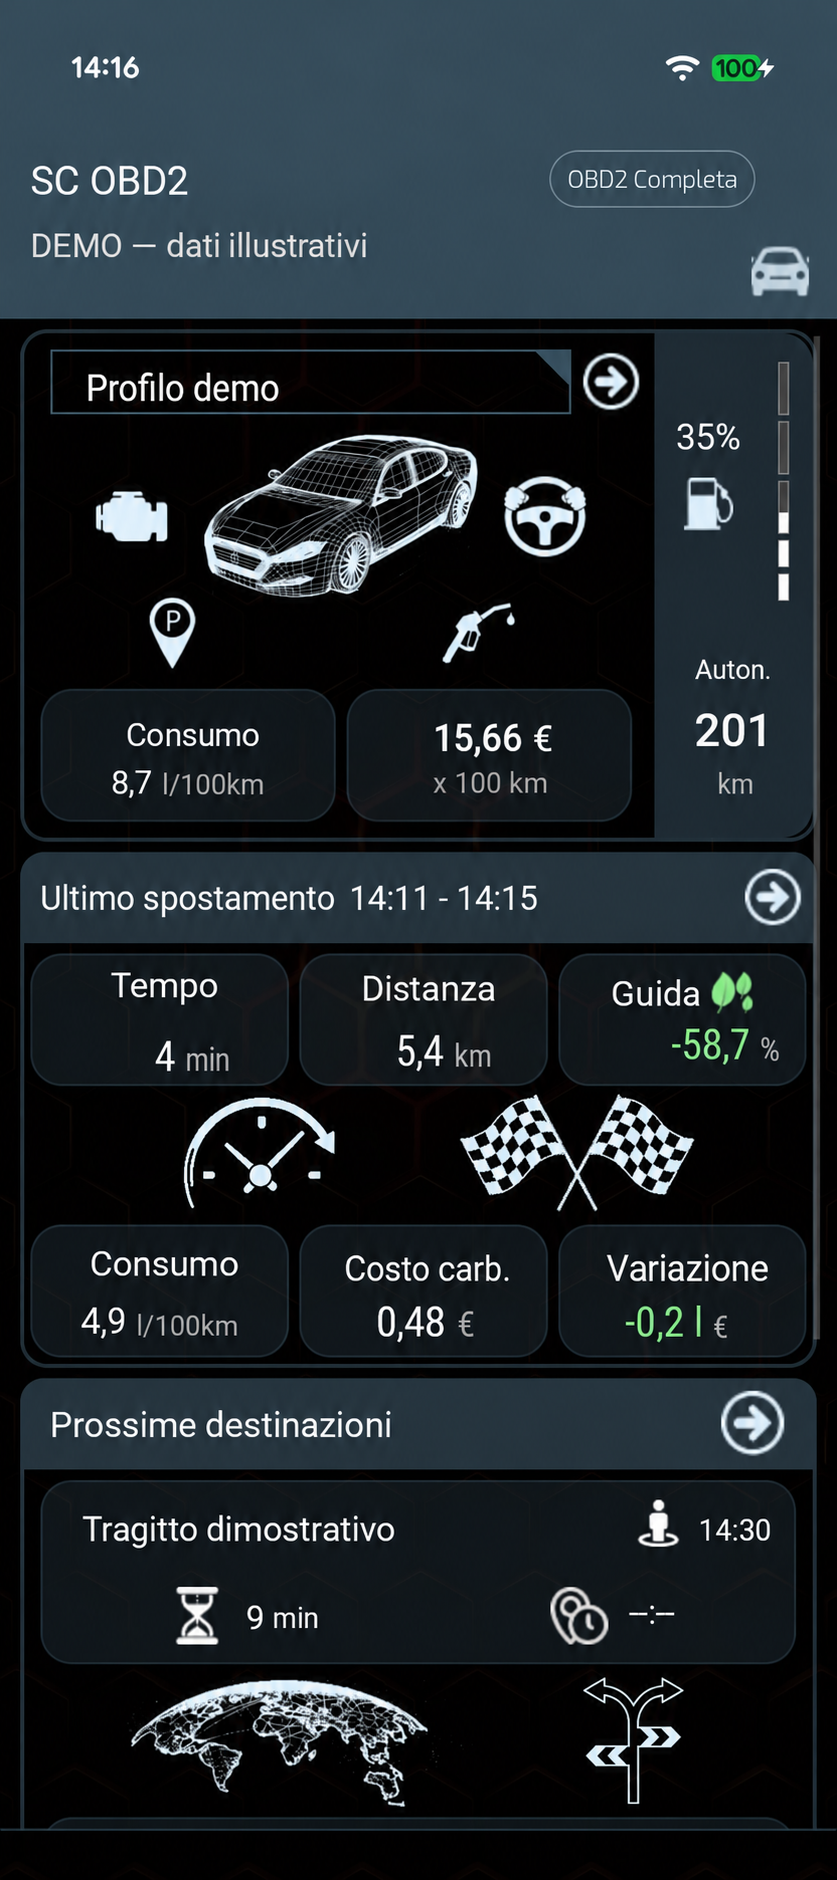
Edited demo illustrationSession fuel information
Distinguish fuel quantity, tank level and consumption per unit distance.
Illustrative fuel example: 0.1 l rounded, €0.17 cost and 201 km estimated range. Edited image using stated assumptions.
How to read this screen
The added fields are illustrative examples using fuel at €1.80/l and a 50 l tank. Cost uses unrounded fuel consumption; range uses the vehicle profile’s consumption. These are not real test results or guarantees of savings or accuracy.
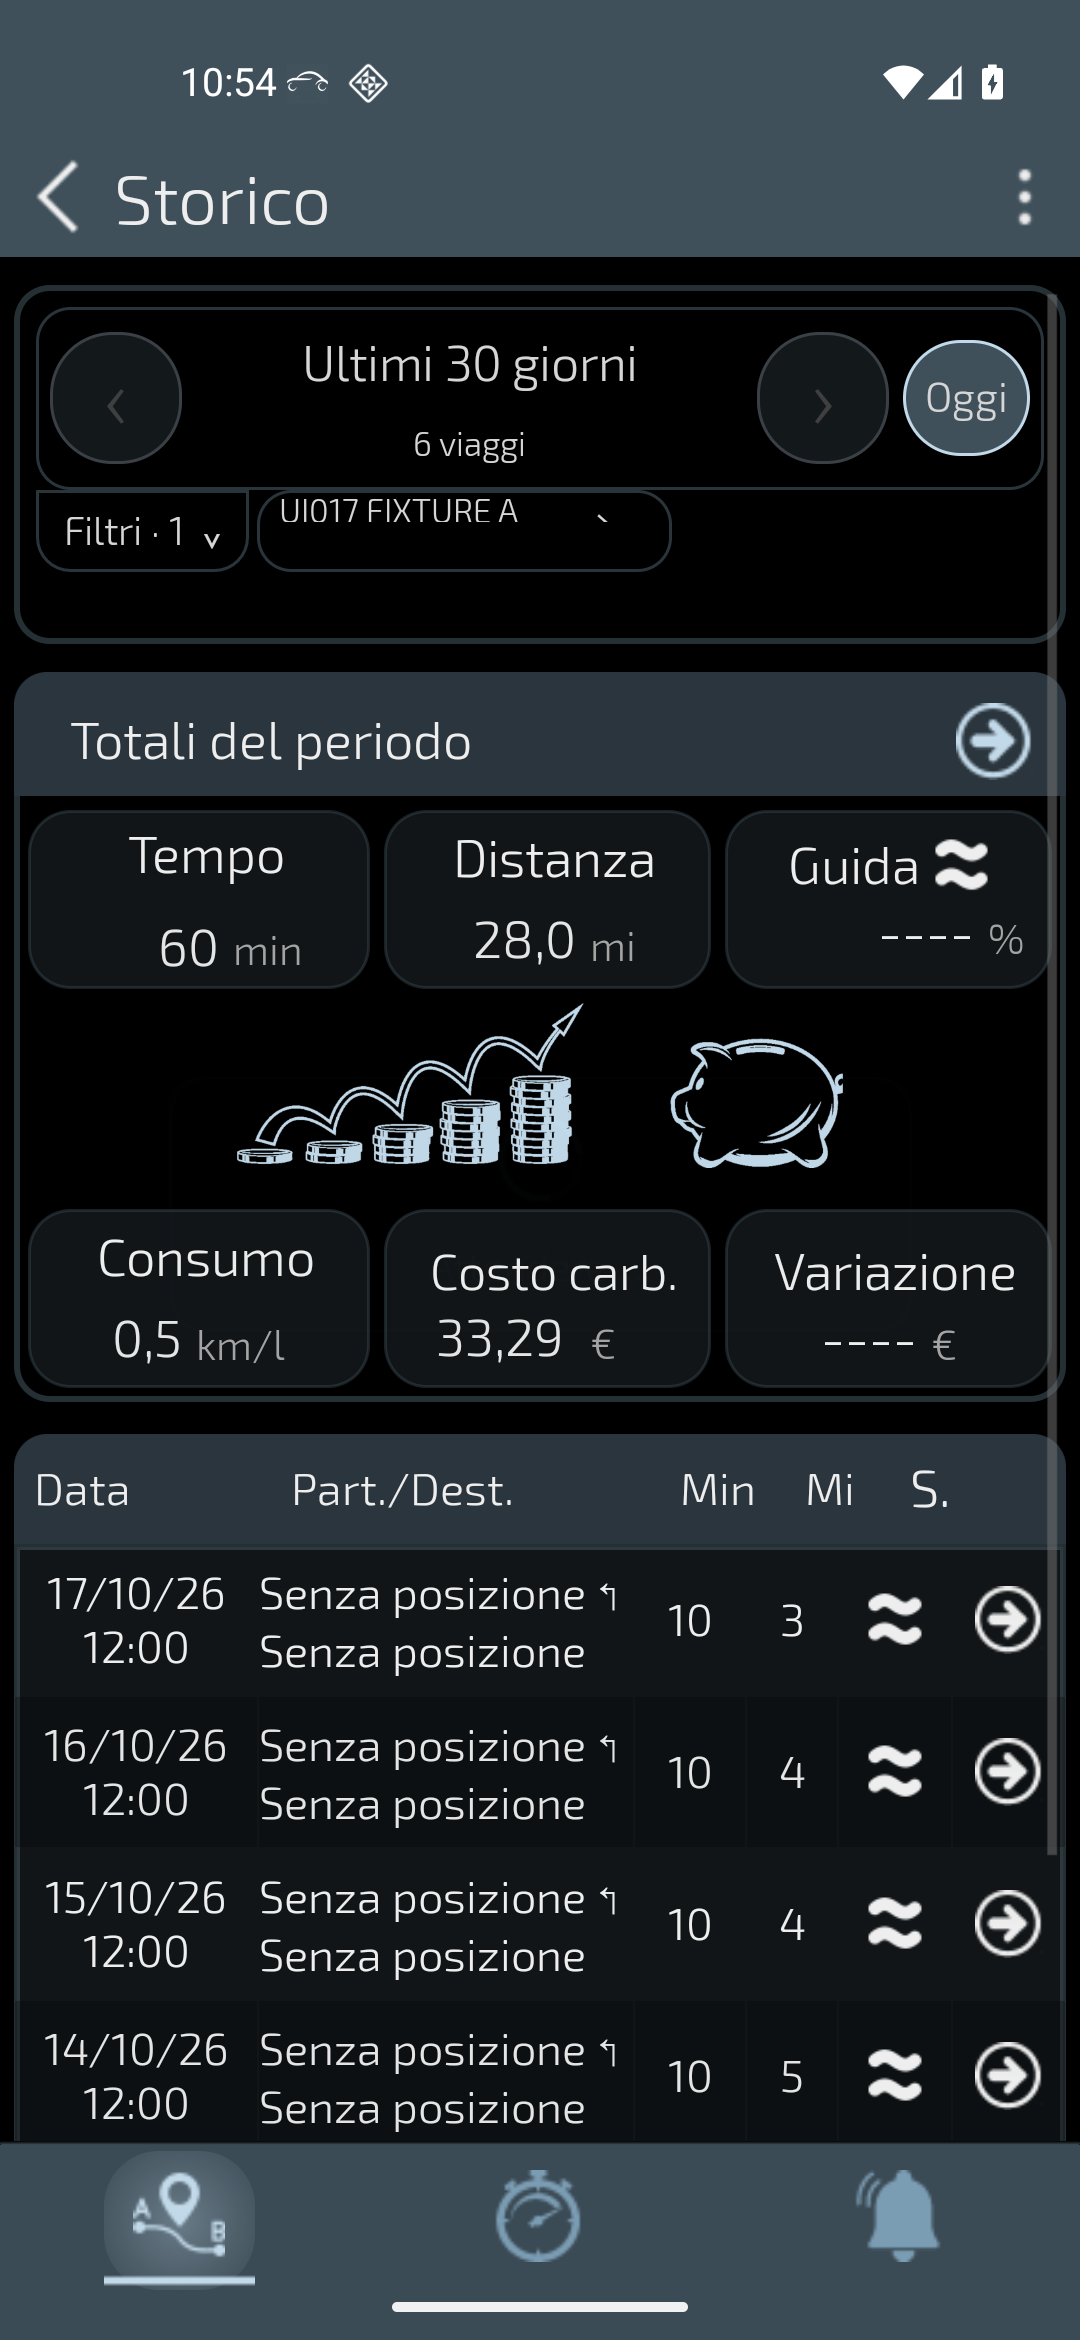
Synthetic test dataMultiple-trip history
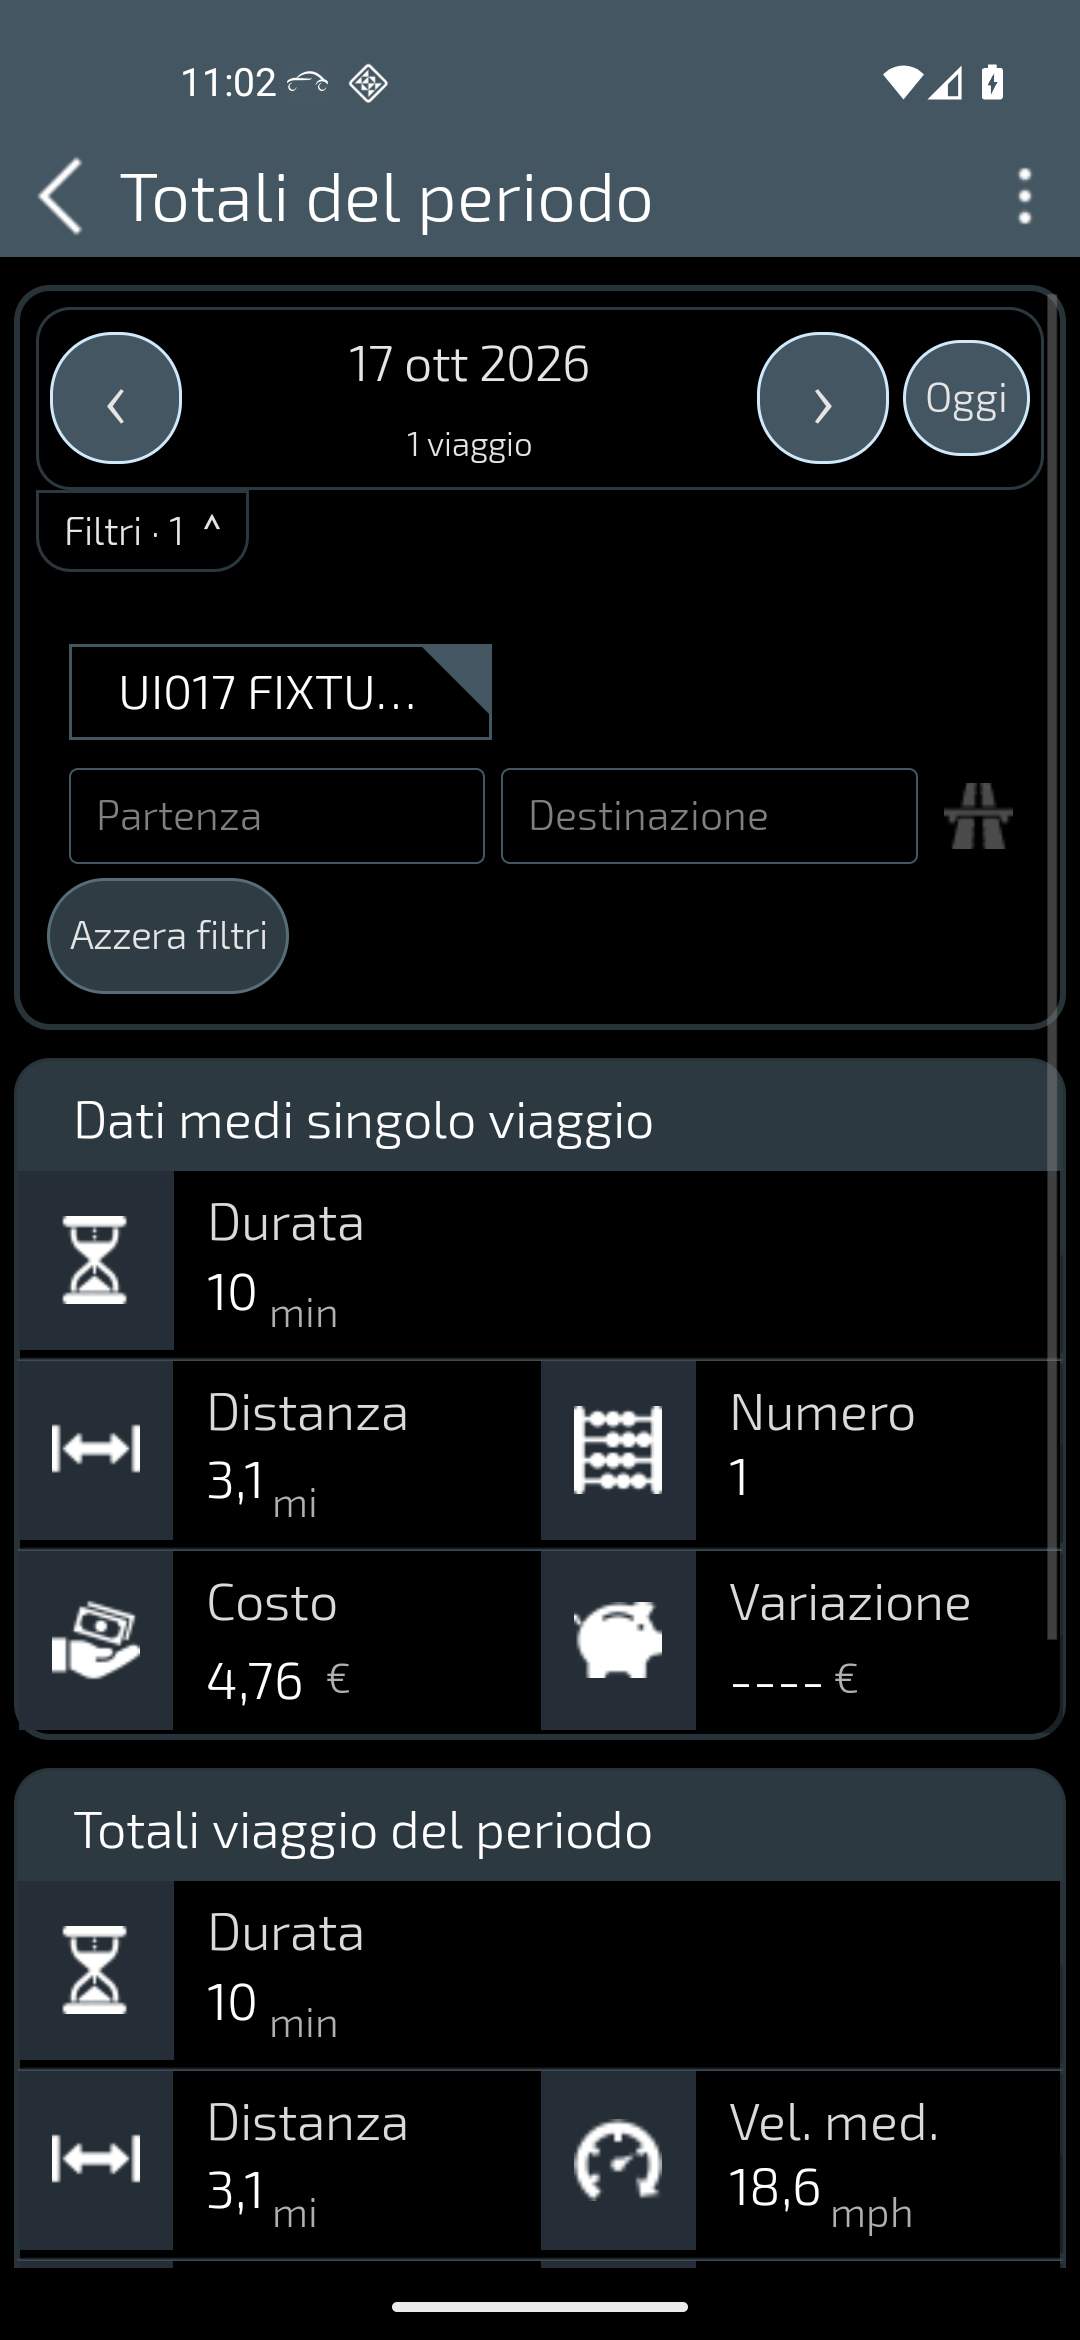
Find several saved entries and compare the totals for a selected period.
App history populated with synthetic test entries: 6 demonstration trips, without real locations.
How to read this screen
Pre-existing synthetic test entries, not real journeys or an integrated demo mode. Distances are in miles, not kilometres. Do not infer real-world efficiency from these synthetic entries.